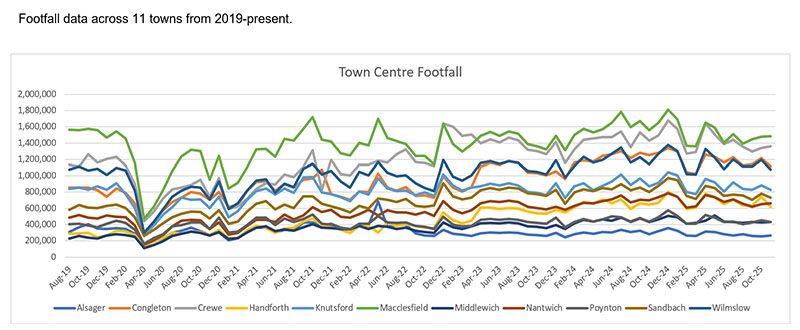
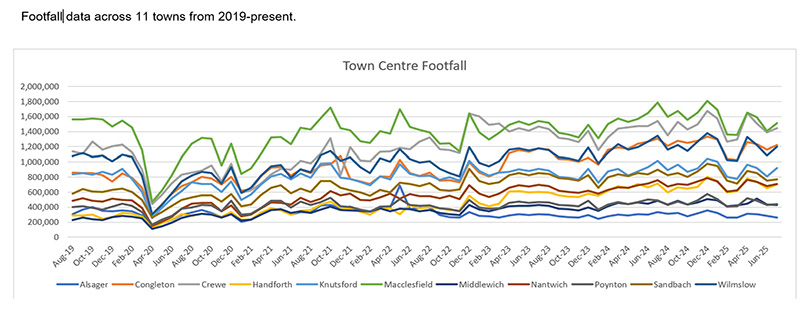
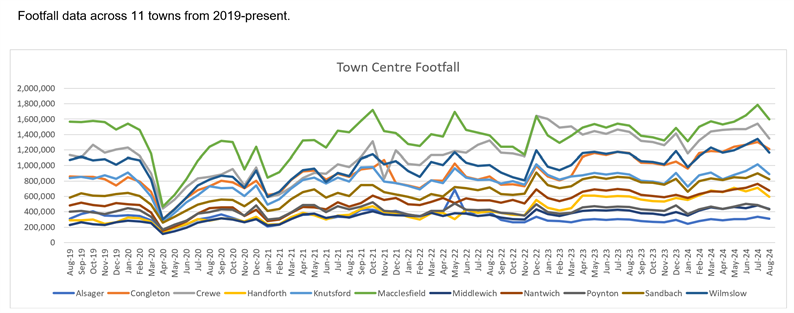
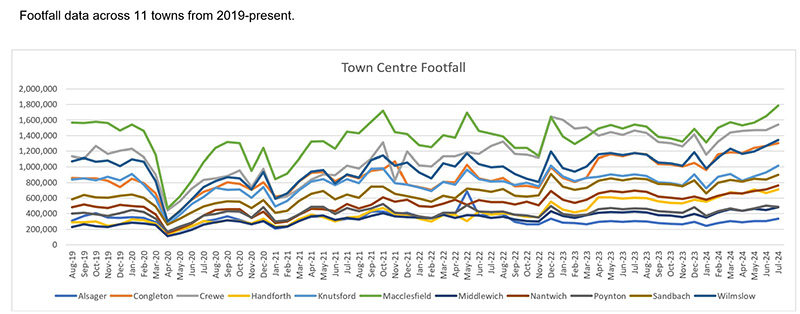
Month on month town centre footfall in Cheshire towns

The performance and purpose of high streets and town centres, is now more than ever under the spotlight. The Council is committed to supporting the vitality and viability of town centres and high streets within its boundaries. To enable informed decision making, the Council has commissioned the collection of data on footfall and movement in 11 town centres. The data allows better understanding of how individual town centres are changing in turn enabling better decisions to be made on policies and initiatives impacting on town centres.

The data collected is entirely anonymised using real-time, geo-located datasets, to build a digital representation of human movement and behavioural patterns over time, without the need for physical infrastructure.

Footfall February 2024-650x262

Town centre footfall for February 2024

February footfall
Town Centre footfall for February 2024February 2024 VisitsFebruary 2023 - February 2024 (Year on Year comparison)February 2019 February 2024 (Pre-pandemic – present comparison)January 2024 - February 2024 (Month on Month comparison)
Alsager 280,491 1% -21% 15%
Congleton 1,160,867 44% 43% 21%
Crewe 1,321,877 -11% 11% 14%
Handforth 616,481 49% 94% 12%
Knutsford 873,106 7% 0% 20%
Macclesfield 1,501,225 16% -2% 15%
Middlewich 415,072 20% 54% 19%
Nantwich 628,342 17% 20% 8%
Poynton 433,667 15% 7% 17%
Sandbach 798,226 13% 28% 21%
Wilmslow 1,120,143 19% -8% 14%

Town centre footfall for January 2024

January footfall
Town Centre footfall for January 2024January 2024 VisitsJanuary 2023 - January 2024 (Year on Year comparison)January 2019 - January 2024 (Pre-pandemic – present comparison)December - January 2024 (Month on Month comparison)
Alsager 244,054 -15% -33% 17%
Congleton 963,125 12% 8% -9%
Crewe 1,156,902 -28% -12% -18%
Handforth 552,359 22% 70% -5%
Knutsford 724,616 -18% -28% -20%
Macclesfield 1,310,210 -6% -19% -12%
Middlewich 348,576 -5% 25% -12%
Nantwich 581,739 0% 5% -6%
Poynton 370,069 -7% -17% -24%
Sandbach 659,420 -12% -3% -20%
Wilmslow 980,422 -1% -22% -17%

Town centre footfall for December 2023

December footfall
Town Centre footfall for December 2023December 2023 VisitsDecember 2022 - December 2023 (Year on Year comparison)December 2019 December 2023 (Pre-pandemic – present comparison)November - December 2023 (Month on Month comparison)
Alsager 295,598 -12% -27% 13%
Congleton 1,053,744 6% 21% 5%
Crewe 1,412,621 -14% -4% 12%
Handforth 907,331 5% 92% 9%
Knutsford 793,187 -11% -6% 19%
Macclesfield 1,487,271 -9% -12% 12%
Middlewich 393,990 -8% 23% 11%
Nantwich 617,688 -11% 0% 5%
Poynton 484,754 -2% 3% 18%
Sandbach 826,448 -9% 10% 10%
Wilmslow 1,186,997 -1% 2% 17%

Town centre footfall for November 2023

November footfall
Town Centre footfall for November 2023November 2023 VisitsNovember 2022 - November 2023 (Year on Year comparison)November 2019 – November 2023 (Pre-pandemic – present comparison)October - November 2023 (Month on Month comparison)
Alsager 261,858 -16% -35% -3%
Congleton 1,004,666 11% 8% -2%
Crewe 1,262,617 -13% -6% -3%
Handforth 532,550 4% 62% -1%
Knutsford 763,299 -13% -22% -4%
Macclesfield 1,324,872 -10% -23% -3%
Middlewich 356,113 -10% 33% -5%
Nantwich 588,555 -9% 9% -2%
Poynton 411,946 -4% 0% -2%
Sandbach 752,167 -9% 8% -3%
Wilmslow 1,014,889 -2% -16% -3%

Town centre footfall for October 2023

October footfall
Town Centre footfall for October 2023October 2023 VisitsOctober 2022 - October 2023 (Year on Year comparison)October 2019 October 2023 (Pre-pandemic – present comparison)September - October 2023 (Month on Month comparison)
Alsager 269,580 -19% -41% -3%
Congleton 1,030,387 5% 7% -1%
Crewe 1,300,226 -19% -12% -1%
Handforth 538,495 4% 62% -4%
Knutsford 793,187 -21% -15% -1%
Macclesfield 1,362,450 -20% -22% -2%
Middlewich 373,631 -13% 34% -2%
Nantwich 603,034 -19% 8% -2%
Poynton 421,979 -15% -3% -2%
Sandbach 775,221 -10% 10% -1%
Wilmslow 1,046,511 -11% -12% -1%

Town centre footfall for September 2023

August footfall
Town Centre footfall for September 2023September 2023 VisitsSeptember 2022 - September 2023 (Year on Year comparison)September 2019 September 2023 (Pre-pandemic – present comparison) August - September 2023 (Month on Month comparison)
Alsager 278,773 -9% -33% -7%
Congleton 1,036,762 21% 7% -11%
Crewe 1,317,201 -5% 3% -8%
Handforth 560,286 17% 73% -6%
Knutsford 802,642 -10% -17% -9%
Macclesfield 1,385,241 -5% -20% -9%
Middlewich 380,805 2% 25% -9%
Nantwich 617,943 3% 4% -9%
Poynton 429,874 -4% -6% -7%
Sandbach 784,743 8% 6% -7%
Wilmslow 1,057,405 -7% -15% -8%

Town centre footfall for August 2023

August footfall
Town Centre footfall for August 2023August 2023 VisitsAugust 2022 - August 2023 (Year on Year comparison)August 2019 – August 2023 (Pre-pandemic – present comparison)July 2023 – August 2023 (Month on Month comparison)
Alsager 299,264 -30% -17% -2%
Congleton 1,159,951 26% 17% -1%
Crewe 1,434,321 0% 6% -2%
Handforth 597,402 36% 80% -1%
Knutsford 885,266 0% -8% -2%
Macclesfield 1,516,923 5% -15% -2%
Middlewich 417,245 8% 53% -3%
Nantwich 680,817 13% 19% -2%
Poynton 460,615 3% -1% -1%
Sandbach 844,440 6% 23% -1%
Wilmslow 1,154,529 11% -7% -2%

Town centre footfall for July 2023

July footfall
Town Centre footfall for July 2023July 2023 VisitsJuly 2022 - July 2023 (Year on Year comparison)July 2019 –July 2023 (Pre-pandemic – present comparison)June 2023 – July 2023 (Month on Month comparison)
Alsager 304,927 -26% -29% 3%
Congleton 1,175,872 40% 29% 4%
Crewe 1,465,288 11% 37% 4%
Handforth 604,342 47% 149% 2%
Knutsford 907,402 7% -5% 3%
Macclesfield 1,540,823 7% -6% 3%
Middlewich 428,451 20% 41% 3%
Nantwich 695,211 19% 9% 3%
Poynton 467,257 9% -1% 2%
Sandbach 854,666 17% 22% 3%
Wilmslow 1,175,559 17% -8% 2%

Town centre footfall for June 2023

June footfall
Town Centre footfall for June 2023June 2023 VisitsJune 2022 - June 2023 (Year on Year comparison)June 2019 –June 2023 (Pre-pandemic – present comparison)May 2023 – June 2023 (Month on Month comparison)
Alsager 295,681 -16% -27% -3%
Congleton 1,134,186 25% 28% -2%
Crewe 1,408,619 12% 21% -3%
Handforth 594,701 28% 144% -3%
Knutsford 882,088 -3% -1% -2%
Macclesfield 1,488,954 -2% -1% -3%
Middlewich 417,628 5% 11% -1%
Nantwich 676,807 7% 19% -2%
Poynton 457,807 2% 1% -3%
Sandbach 826,457 6% 16% -3%
Wilmslow 1,147,333 7% -14% -2%

Town centre footfall for May 2023

May footfall
Town Centre footfall for May 2023May 2023 VisitsMay 2022 - May 2023 (Year on Year comparison)May 2019 –May 2023 (Pre-pandemic – present comparison)April 2023 – May 2023 (Month on Month comparison)
Alsager 304,012 -22% -25% 4%
Congleton 1,157,561 41% 29% 4%
Crewe 1,446,619 20% 11% 3%
Handforth 610,872 51% 141% 1%
Knutsford 904,636 8% -6% 4%
Macclesfield 1,535,467 10% -7% 3%
Middlewich 420,548 17% 12% 2%
Nantwich 690,811 21% 17% 5%
Poynton 472,007 11% 4% 3%
Sandbach 852,985 22% 28% 3%
Wilmslow 1,176,394 18% -8% 2%

Town centre footfall for April 2023

April footfall
Town Centre footfall for April 2023April 2023 VisitsApril 2022 - April 2023 (Year on Year comparison)April 2019 – April 2023 (Pre-pandemic – present comparison)March 2023 – April 2023 (Month on Month comparison)
Alsager 292,364 -29% -28% 12%
Congleton 1,115,805 28% 25% 29%
Crewe 1,398,102 9% 11% -7%
Handforth 607,644 41% 105% 35%
Knutsford 872,289 -2% -3% 2%
Macclesfield 1,489,832 0% -8% 8%
Middlewich 413,394 8% 23% 9%
Nantwich 660,397 10% 9% 14%
Poynton 459,572 2% 4% 19%
Sandbach 824,452 11% 21% 13%
Wilmslow 1,157,837 10% -10% 15%

Town centre footfall for March 2023

March footfall
Town Centre footfall for March 2023March 2023 VisitsMarch 2022 - March 2023 (Year on Year comparison)March 2019 – March 2023 (Pre-pandemic – present comparison)February 2023 – March 2023 (Month on Month comparison)
Alsager 261,308 -44% -33%
Congleton 862,641 -15% -1%
Crewe 1,504,607 4% 10%
Handforth 448,473 -5% 34%
Knutsford 857,878 -17% -14%
Macclesfield 1,383,181 -20% -23%
Middlewich 379,327 -20% 21%
Nantwich 579,330 -5% 4%
Poynton 386,040 -24% -18%
Sandbach 732,190 -17% 0%
Wilmslow 1,007,338 -19% -29%


Town centre footfall for February 2023

February footfall
Town Centre footfall for February 2023February 2023 VisitsFebruary 2022 - February 2023 (Year on Year comparison)February 2019 – February 2023 (Pre-pandemic – present comparison)January 2023 – February 2023 (Month on Month comparison)
Alsager 278,494 -32% -21% -3%
Congleton 808,540 -7% -1% -6%
Crewe 1,488,182 18% 25% -7%
Handforth 414,484 14% 31% -9%
Knutsford 818,663 -6% -6% -7%
Macclesfield 1,293,147 -14% -16% -7%
Middlewich 346,311 -15% 29% -6%
Nantwich 537,416 -3% 3% -7%
Poynton 376,406 -9% -7% -6%
Sandbach 708,576 -6% 13% -5%
Wilmslow 940,953 -6% -23% -5


Town centre footfall for January 2023

January footfall
Town Centre footfall for January 2023January 2023 VisitsJanuary 2022 - January 2023 (Year on Year comparison)January 2019 – January 2023 (Pre-pandemic – present comparison)December 2022 – January 2023 (Month on Month comparison)
Alsager 286,385 -33% -21% -14%
Congleton 857,556 -6% -4% -14%
Crewe 1,601,157 25% 22% -2%
Handforth 453,002 11% 40% -18%
Knutsford 880,755 -5% -13% -13%
Macclesfield 1,388,418 -10% -15% 15%
Middlewich 368,316 -11% 32% -14%
Nantwich 580,149 3% 5% -16%
Poynton 398,380 -10% -10% -20%
Sandbach 747,088 -8% 9% -18%
Wilmslow 988,850 -9% -22% -17%


Town centre footfall for December 2022

December footfall
Town CentreDecember 2022 VisitsDecember 2021 – December 2022 (Year on Year comparison)December 2019 – December 2022 (Pre-pandemic – present comparison)November 2022 – December 2022 (Month on Month comparison)
Alsager 334794 -18% -3% 27%
Congleton 997226 29% 36% 36%
Crewe 1641566 10% 12% 13%
Handforth 551910 19% 82% 15%
Knutsford 1017990 5% 6% 16%
Macclesfield 1639079 -4% -3% 12%
Middlewich 427397 0% 33% 7%
Nantwich 691166 6% 12% 7%
Poynton 496678 3% 6% 15%
Sandbach 908439 8% 9% 21%
Wilmslow 1193394 -2% 2% 15%

Town centre footfall for November 2022

November footfall
Town CentreNovember 2022 VisitsNovember 2021 –November 2022 (Year on Year comparison)November 2019 –November 2022 (Pre-pandemic – present comparison)October 2022 – November 2022 (Month on Month comparison)
Alsager 262817 -33% -24% -1%
Congleton 731824 -12% -11% -3%
Crewe 1117644 4% -3% -3%
Handforth 355431 -10% 47% -2%
Knutsford 751489 -5% -13% -6%
Macclesfield 1138637 -21% -26% -8%
Middlewich 297451 -18% 31% -3%
Nantwich 508411 -8% 8% -8%
Poynton 348205 -15% -5% -7%
Sandbach 633454 -4% 6% 2%
Wilmslow 810727 -20% -25% -5%

Town centre footfall for October 2022

February footfall
Town CentreOctober 2022 VisitsOctober 2021 – October 2022 (Year on Year comparison)October 2019 – October 2022 (Pre-pandemic – present comparison) September 2022 – October 2022 (Month on Month comparison)
Alsager 264612 -38% -34% -10%
Congleton 756903 -11% -11% 1%
Crewe 1156274 -12% -8% -1%
Handforth 362225 -23% 22% -6%
Knutsford 798474 -19% -3% 4%
Macclesfield 1242867 -28% -20% 0%
Middlewich 306807 -25% 29% -6%
Nantwich 552858 -10% 15% 6%
Poynton 374888 -28% -3% -2%
Sandbach 620130 -17% 3% -1%
Wilmslow 851351 -26% -19% -6%

Town centre footfall for September 2022

February footfall
Town CentreSeptember 2022 VisitsSeptember 2021-September 2022  (Year on Year comparison)September2019-September 2022  (Pre-pandemic – present comparison) August 2022-September 2022  (Month on Month comparison)
Alsager 292705 -31% -20% -26%
Congleton 753059 -21% -11% -13%
Crewe 1164545 5% 6% -12%
Handforth 385751 12% 34% -4%
Knutsford 766050 -22% -9% -6%
Macclesfield 1240378 -21% -20% -11%
Middlewich 325488 -12% 25% -10%
Nantwich 520667 2% 2% -5%
Poynton 383541 -18% -6% -10%
Sandbach 629078 -16% -1% -12%
Wilmslow 907627 -16% -18% -10%

Town centre footfall for August 2022

February footfall
Town CentreAugust 2022 VisitsAugust 2021-August 2022  (Year on Year comparison)August 2019-August 2022  (Pre-pandemic – present comparison) July 2022-August 2022  (Month on Month comparison)
Alsager 397,929 20% 30% 1%
Congleton 861,161 1% 1% 5%
Crewe 1,324,454 35% 18% 5%
Handforth 403,908 11% 41% 5%
Knutsford 819,146 3% -1% 1%
Macclesfield 1,387,333 -3% -11% -2%
Middlewich 362,514 12% 60% 5%
Nantwich 548,385 18% 14% 0%
Poynton 425,685 -1% 7% 1%
Sandbach 718,792 19% 24% 6%
Wilmslow 1,008,264 17% -5% 1%


Town centre footfall for July 2022

February footfall
Town CentreJuly 2022 VisitsJuly 2021 – July 2022 (Year on Year comparison)July 2019 – July 2022 (Pre-pandemic – present comparison) June 2022 –July 2022 (Month on Month comparison)
Alsager 392,446 17% 6% 21%
Congleton 817,060 -9% 3% -5%
Crewe 1,264,693 25% 39% 9%
Handforth 385,228 10% 80% -10%
Knutsford 812,308 -4% -3% -4%
Macclesfield 1,421,964 -2% -2% -3%
Middlewich 345,379 1% 34% -8%
Nantwich 548,544 5% 0% -5%
Poynton 420,439 -11% 0% -2%
Sandbach 681,279 5% 14% -4%
Wilmslow 994,355 10% -12% -4%


Town centre footfall for June 2022

February footfall
Town CentreJune 2022 VisitsJune 2021 – June 2022 (Year on Year comparison)June 2019 – June 2022 (Pre-pandemic – present comparison) May 2022 –June 2022 (Month on Month comparison)
Alsager 325,205 7% -9% -53%
Congleton 855,793 4% 8% -17%
Crewe 1,163,640 30% 16% -2%
Handforth 428,979 44% 96% 40%
Knutsford 844,087 10% 8% -13%
Macclesfield 1,461,493 19% 8% -23%
Middlewich 375,667 17% 16% 26%
Nantwich 576,467 33% 15% 13%
Poynton 428,077 9% 6% -15%
Sandbach 706,308 21% 14% -2%
Wilmslow 1,038,135 31% -13% -11%


Town centre footfall for May 2022

February footfall
Town CentreMay 2022 VisitsMay 2021 – May 2022 (Year on Year comparison)May 2019 – May 2022 (Pre-pandemic – present comparison) April 2022 –May 2022 (Month on Month comparison)
Alsager 685,703 88% 92% 74%
Congleton 1,026,152 10% 30% 28%
Crewe 1,182,847 30% 6% 4%
Handforth 305,802 -14% 35% -21%
Knutsford 968,208 15% 14% 26%
Macclesfield 1,695,658 28% 15% 24%
Middlewich 381,469 1% 19% 10%
Nantwich 512,051 11% 0% -12%
Poynton 505,765 4% 25% 23%
Sandbach 722,588 5% 26% 21%
Wilmslow 1,167,266 22% 3% 16%

Town centre footfall for April 2022

February footfall
Town CentreApril 2022 VisitsApril 2021 – April 2022 (Year on Year comparison)April 2019 – April 2022 (Pre-pandemic – present comparison) March 2022 – April 2022 (Month on Month comparison)
Alsager 395,074 9% 11% 3%
Congleton 803,575 -13% 3% 0%
Crewe 1,135,910 36% 6% 0%
Handforth 384,754 0% 44% 1%
Knutsford 771,296 -5% -3% -4%
Macclesfield 1,370,898 4% -6% -2%
Middlewich 347,183 -5% 22% -10%
Nantwich 581,718 26% 10% 10%
Poynton 409,677 -16% 5% 0%
Sandbach 599,101 -9% 2% -5%
Wilmslow 1,005,109 7% -12% -4%

Town centre footfall for March 2022

February footfall
Town CentreMarch  2022 VisitsMarch 2021 – March 2022 (Year on Year comparison)March 2019 – March 2022 (Pre-pandemic – present comparison) February 2022 – March 2022 (Month on Month comparison)
Alsager 382,330 22% 12% 10%
Congleton 806,028 -1% 5% 14%
Crewe 1,133,157 58% -3% 12%
Handforth 381,424 15% 27% 27%
Knutsford 807,318 15% -8% 17%
Macclesfield 1,405,199 27% -13% 13%
Middlewich 383,678 27% 42% 12%
Nantwich 528,167 38% 9% 8%
Poynton 409,400 4% -3% 20%
Sandbach 629,577 12% -1% 14%
Wilmslow 1,046,404 28% -17% 22%

Town centre footfall for February 2022

February footfall
Town CentreFebruary 2022 VisitsFebruary 2021 –February 2022 (Year on Year comparison)February 2020 – February 2022 (Pre-pandemic – present comparison) January 2022 – February 2022 (Month on Month comparison)
Alsager 347,306 50% -4% 11%
Congleton 706,970 10% -5% -3%
Crewe 1,008,715 62% -1% -2%
Handforth 299,909 27% -11% 5%
Knutsford 688,781 22% -6% -12%
Macclesfield 1,248,856 37% -2% -10%
Middlewich 341,198 46% -2% 47%
Nantwich 488,061 62% -2% 7%
Poynton 342,169 9% -6% -6%
Sandbach 552,353 26% -7% 2%
Wilmslow 854,548 29% -8% -22%

Town centre footfall for January 2022

January footfall
Town CentreJanuary 2022 VisitsJanuary 2021 – January 2022 (Year on Year comparison)January 2020 – January 2022 (Pre-pandemic – present comparison) December 2021 – January 2022 (Month on Month comparison)
Alsager 362,499 78% -11% 12%
Congleton 743,247 22% -4% -7%
Crewe 1,021,725 77% -14% -10%
Handforth 337,146 48% -12% 14%
Knutsford 736,477 53% -5% -19%
Macclesfield 1,274,267 54% -10% -14%
Middlewich 348,468 61% -3% 44%
Nantwich 495,825 83% -15% 2%
Poynton 364,067 24% -9% -9%
Sandbach 595,138 48% -5% 0%
Wilmslow 932,338 61% -12% -18%

Town centre footfall for December 2021

December footfall
Town CentreDecember 2021 VisitsDecember 2020 – December 2021 (Year on Year comparison)December 2019 – December 2021 (Pre-pandemic – present comparison) November 2021 – December 2021 (Month on Month comparison)
Alsager 409,288 35% 4% 19%
Congleton 774,489 -4% -6% 5%
Crewe 1,193,653 22% 11% 0%
Handforth 385,110 16% -3% 47%
Knutsford 774,296 4% -3% -6%
Macclesfield 1,418,072 14% -2% -2%
Middlewich 357,437 17% -2% 36%
Nantwich 581,617 37% 5% 14%
Poynton 400,257 -17% -3% -1%
Sandbach 624,214 9% -5% 0%
Wilmslow 1,058,866 13% 4% 6%

Town centre footfall for November 2021

November footfall
Town CentreNovember 2021 VisitsNovember 2020 – November 2021 (Year on Year comparison)November 2019 – November 2021 (Pre-pandemic – present comparison) October 2021 – November 2021 (Month on Month comparison)
Alsager 391,810 45% -9% 13%
Congleton 1,074,207 17% -15% 1%
Crewe 828,071 45% -18% -7%
Handforth 395,114 45% -17% 63%
Knutsford 794,477 32% -19% -8%
Macclesfield 1,442,629 56% -16% -7%
Middlewich 363,700 38% -11% 60%
Nantwich 555,146 61% -9% 18%
Poynton 411,760 18% -21% 13%
Sandbach 656,466 38% -12% 10%
Wilmslow 1,016,742 42% -11% -5%

Town centre footfall for October 2021

October footfall
Town CentreOctober 2021 VisitsOctober 2020 – October 2021 (Year on Year comparison)October 2019 – October 2021 (Pre-pandemic – present comparison) September 2021 – October 2021 (Month on Month comparison)
Alsager 428,928  34% 7% 1%
Congleton 969,786 24% 15% 2%
Crewe 1,312,422 37% 5% 18%
Handforth 473,425 54% 60% 8%
Knutsford 982,075 38% 20% 0%
Macclesfield 1,717,182 32% 10% 9%
Middlewich 406,531 36% 71% 10%
Nantwich 611,985 34% 27% 19%
Poynton 522,099 23% 35% 12%
Sandbach 746,025 34% 24% 0%
Wilmslow 1,143,308 34% 8% 5%

Town centre footfall for September 2021

September footfall
Town CentreSeptember 2021 VisitsSeptember 2020 – September 2021 (Year on Year comparison)September 2019 – September 2021 (Pre-pandemic – present comparison) August 2021 – September 2021 (Month on Month comparison)
Alsager 425,719  18% 16% 29%
Congleton 951,456 20% 12% 11%
Crewe 1,109,836 27% 1% 13%
Handforth 437,563 42% 52% 21%
Knutsford 977,209 40% 16% 23%
Macclesfield 1,577,176 21% 2% 10%
Middlewich 368,154 20% 42% 14%
Nantwich 512,633 13% 0% 10%
Poynton 467,094 10% 15% 9%
Sandbach 747,897 36% 18% 24%
Wilmslow 1,086,798 27% -2% 26%

Town centre footfall for August 2021

August footfall
Town CentreAugust 2021 VisitsAugust 2020 – August 2021 (Year on Year comparison)August 2019 – August 2021 (Pre-pandemic – present comparison) August 2021 – August 2021 (Month on Month comparison)
Alsager 330,540  +3% +8% -1%
Congleton 855,291 +18% +1% -5%
Crewe 983,108 +16% -13% -3%
Handforth 362,882 +28% +27% +3%
Knutsford 792,021 +9% -5% -6%
Macclesfield 1,429,170 +17% -8% -1%
Middlewich 323,273 +13% +43% -6%
Nantwich 465,840 +5% -3% -11%
Poynton 430,176 +10% +8% -9%
Sandbach 602,497 +15% +4% -7%
Wilmslow 861,905 +6% -19% -5%

Town centre footfall for July 2021

July footfall
Town CentreJuly 2021 VisitsJuly 2020 – July 2021 (Year on Year comparison)July 2019 – July 2021 (Pre-pandemic – present comparison) June 2021 – July 2021 (Month on Month comparison)
Alsager 335,030 +13% -9% +11%
Congleton 896,856 +32% +13% +9%
Crewe 1,014,535 +22% +12% +13%
Handforth 350,710 +15% +64% +17%
Knutsford 845,303 +37% +1% +10%
Macclesfield 1,449,455 +38% 0% +18%
Middlewich 342,905 +32% +34% +7%
Nantwich 523,528 +39% -5% +21%
Poynton 472,938 +25% +13% +20%
Sandbach 647,705 +31% +8% +11%
Wilmslow 905,962 +22% -20% +15%

Town centre footfall for June 2021

June footfall
Town CentreJune 2021 visitsJune 2020 – June 2021 (Year on Year comparison)June 2019 – June 2021 (Pre-pandemic – present comparison)May 2021 – June 2021 (Month on Month comparison)
Alsager 302,980 +29% -15% -17%
Congleton 820,279 +42% +4% -12%
Crewe 895,389 +25% -11% -1%
Handforth 298,590 +25% +37% -16%
Knutsford 768,623 +48% -2% -9%
Macclesfield 1,231,022 +49 -9% -7%
Middlewich 320,941 +65% -1% -15%
Nantwich 432,513 +59% -13% -6%
Poynton 394,116 +40% -2% -19%
Sandbach 586,075 +32% -5% -15%
Wilmslow 789,672 +35% -34% -18%

Town centre footfall for May 2021

May 2021 footfall
Town CentreMay 2021 VisitsMay 2020 – May 2021 (Year on Year comparison)May 2019 – May 2021 (Pre-pandemic – present comparison)April 2021 - May 2021 (Month on Month Comparison)
Alsager 365,028 +93% +2% +1%
Congleton 933,337 +93% +18% +1%
Crewe 906,91 +62% -19% +8%
Handforth 355,758 +68% +58% -8%
Knutsford 844,150 +118% -1% +4%
Macclesfield 1,328,065 +114% -10% 0%
Middlewich 376, 149 +158% +17% +3%
Nantwich 459,487 +121% -10% 0%
Poynton 485,185 +110% +20% 0%
Sandbach 691,437 +93% +20% +5%
Wilmslow 958,521 +93% +20% +2%

Town centre footfall for April 2021

Town Centre Footfall April 2021
Town centreApril 2021 VisitsApril 2020 – April 2021 (Year on Year comparison)April 2019 – April 2021 (Pre-pandemic – present comparison)March 2021 – April 2021 (Month on Month comparison)
Alsager 362,803 +145% +4% +14%
Congleton 923,216 +202% +21% +12%
Crewe 837,332 +90% -20% +15%
Handforth 386,357 +209% +49% +14%
Knutsford 811,467 +213% +5% +13%
Macclesfield 1,324,043 +184% -7% +17%
Middlewich 363,951 +228% +31% +17%
Nantwich 460,885 +205% +66% +17%
Poynton 486,223 +193% +27% +19%
Sandbach 656,076 +151% +14% +14%
Wilmslow 941,300 +214% -7% +13%

Page last reviewed: 15 April 2024